
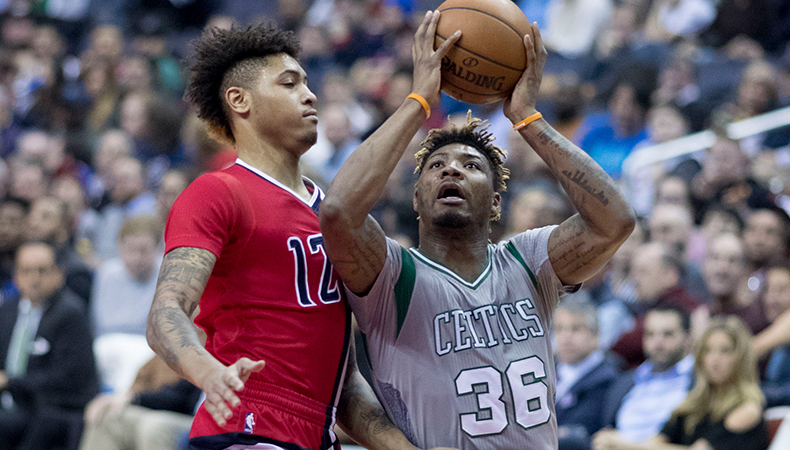
After a close Game 7 loss to LeBron and the Cavs, a frustrated Marcus Smart ranted about his upcoming free agency. “To be honest, I’m worth more than $12-14 million, just for the things I do on the court that don’t show up on the stat sheet,” he said. “You don’t find guys like that. I always leave everything on the court, every game. Tell me how many other players can say that.”
Two months later, Smart signed a 4-year $52 million extension with the Boston Celtics. Celtics fans breathed a sigh of relief; they knew firsthand that Smart was a crucial part of their team, putting in maximum effort night after night. But casual basketball fans were confused. How could a competitive team like the Celtics afford to commit so much money to a player who averages a measly 10.2 points per game and shoots an atrocious 36 percent from the field? (The average among guards is 43 percent!**)
Here is Smart compared to other guards who averaged similar numbers in the 2017-18 season, focusing on the most conventional statistical categories.
| Points per game | Rebounds per game | Assists per game | Shooting percentage | 2018-2019 Salary | |
| Marcus Smart | 10.2 | 3.5 | 4.8 | .367 | $11.6M |
| Ish Smith | 10.9 | 2.7 | 4.4 | .486 | $6M |
| Spencer Dinwiddie | 12.6 | 3.2 | 6.6 | .387 | $1.5M |
| JJ Barea | 11.6 | 2.9 | 6.3 | .439 | $3.7M |
While using player salary as a direct measure of player value is not always reliable, Smart’s contract suggests his value cannot solely be quantified by these basic categories.
Points, assists, and shooting percentage are strictly offensive statistics, but the game of basketball is only 50 percent offense. So how do we measure defensive value? An easily accessible yet often overlooked statistic is steals per game. Smart’s average steal rate of 1.3 steals per game is among the top 50 in the NBA. A good number, but not exceptional.
In an article for the Washington Post, Justin Willard argues that the best measure of a “no-stats-all-star” is the ability to draw offensive fouls. On average, a steal costs the opposing team 1.1 points per 100 possessions, but an offensive foul costs the opposing team 1.4 points per 100 possessions. Smart draws an average of 46.25 offensive fouls per season, well above the league average. In three of his four years in the NBA, Smart has been one of the top four players in most offensive fouls drawn. Combine this number with his above average steal numbers, and Smart transforms into a defensive menace.
How else can we measure Smart’s court presence? Another approach is to examine the scoring of the Celtics and their opponents when Smart is on and off the court. Team offensive rating is the average number of points scored by a team per 100 possessions. The Celtics’ offensive rating with Smart on the court is 108.4, versus 107.9 with Smart off the court. The small difference is not surprising, as we have noted that Smart’s offensive abilities are not sensational. However, the Celtics’ opponents’ average offensive rating with Smart on the court is 101.7 versus 106.3 with Smart off the court, a staggering difference of 4.6.
| Opponent’s Average Difference in Offensive Rating (Off – On) | |
| Victor Oladipo* | 9.2 |
| Jrue Holiday* | 8.7 |
| Marcus Smart | 4.6 |
| Spencer Dinwiddie | 0.9 |
| Ish Smith | 0.5 |
| JJ Barea | -1.4 |
*Indicates 2018 NBA All-Defensive First Team
The only skill left to quantify is Smart’s hustle. How can a player’s willingness to grind be quantified by a number? The hustle stat, which the NBA debuted in 2016, was a weighted linear combination of screen assists, shot contests, deflections, loose ball recoveries, and charges. It was quickly discontinued, likely because there were disagreements about how each category should be weighted. But the NBA continued tracking all the categories of the hustle stat, and the numbers can be found for each player.
Hustle Stats Per Game (17-18 Regular Season)**
| Screen Assists | Deflections | Loose Balls Recovered | Charges Drawn | Contested 2 Point Shots | Contested 3 Point Shots | Contested Shots | |
| Marcus Smart | 0.3 | 3 | 0.9 | 0.29 | 3.2 | 3.3 | 6.5 |
| Smart’s Percentile Among All Guards | 80 | 93 | 33 | 99 | 75 | 91 | 83 |
Before comparing his stats to other guards’ stats, it may be difficult to tell whether or not Smart’s numbers are significant. This is because different categories of the hustle stat cater to different positions. For example, players who contest the most shots are centers, who can stand in the paint and extend their long arms at every lay-up attempt. Similarly, screen assists are negligible in determining Smart’s value because guards set far fewer screens than big men. It is evident from the percentiles, however, that Smart is an elite defensive guard who excels in nearly every hustle category.
At the end of the day, statistical tools can only determine the range of a player’s value – it is near impossible to isolate a single player’s raw skill from the impact of the other nine players on the court. It is clear Marcus Smart adds significant value that is not captured by conventional metrics. The Celtics made a smart decision.
**Values calculated using players with a minimum of 20 games played in the 2017-18 season


Subscribe Now
Get each new post sent straight to your inbox