
One of the simplest applications of game theory and strategy to sports is pitch selection in baseball. On every single play, the pitcher has dozens of possibilities in his arsenal. For example, Arizona Diamondbacks’ star Zack Greinke has five main pitches: two types of fastballs (four seam and two seam), a slider, a curveball, and a change-up. In addition, on each pitch, Greinke can decide where to locate the ball – low and inside, high and outside, etc.
In my opinion, Greinke’s best pitch is his slider, which has helped him strike out thousands of batters over the course of his career. However, Greinke cannot throw his slider every play. If the batter knows Greinke is about to throw an 85 mile per hour slider (this pitch is about 10mph slower than a fastball), then it becomes much easier for the batter to change his strategy and reach base. It’s like the pitcher is playing a poker game with his hand up – almost impossible to win. Thus, Greinke must balance his most effective pitch, the slider, with change-ups, fastballs, and other pitches to keep the hitter guessing.
This logic works in the opposite direction, too. If Greinke knew what the hitter was expecting, then he’d simply change his strategy – when the batter is expecting an inside fastball, an outside curveball becomes an extremely effective pitch for Greinke.
It’s clear in the game of baseball there’s a constant battle driven by strategy between the pitcher and the batter. Let’s dig a bit deeper into analyzing the strategies a high-level pitcher might use. We’ll use historical pitch count data of star Zack Greinke.
Before diving into the data, let’s set the scene: imagine Greinke is facing a hitter with the advantage of a 0-2 count (0 balls, 2 strikes). On this count, most pitchers want to throw balls away from the plate, tempting batters to chase pitches outside of the strike zone that have a low probability of being hit. Since the risk of walking the batter is low (a walk requires four balls and the pitcher has already thrown two strikes!), pitchers do not want to throw any pitch that gives the batter a solid chance of making contact and getting on base. Thus, as the count progresses in the pitchers favor (from 0-0 to 0-1 to 0-2), most pitchers strategically begin to throw balls out of zone more often, as their risk of walking the hitter decreases with each additional strike.
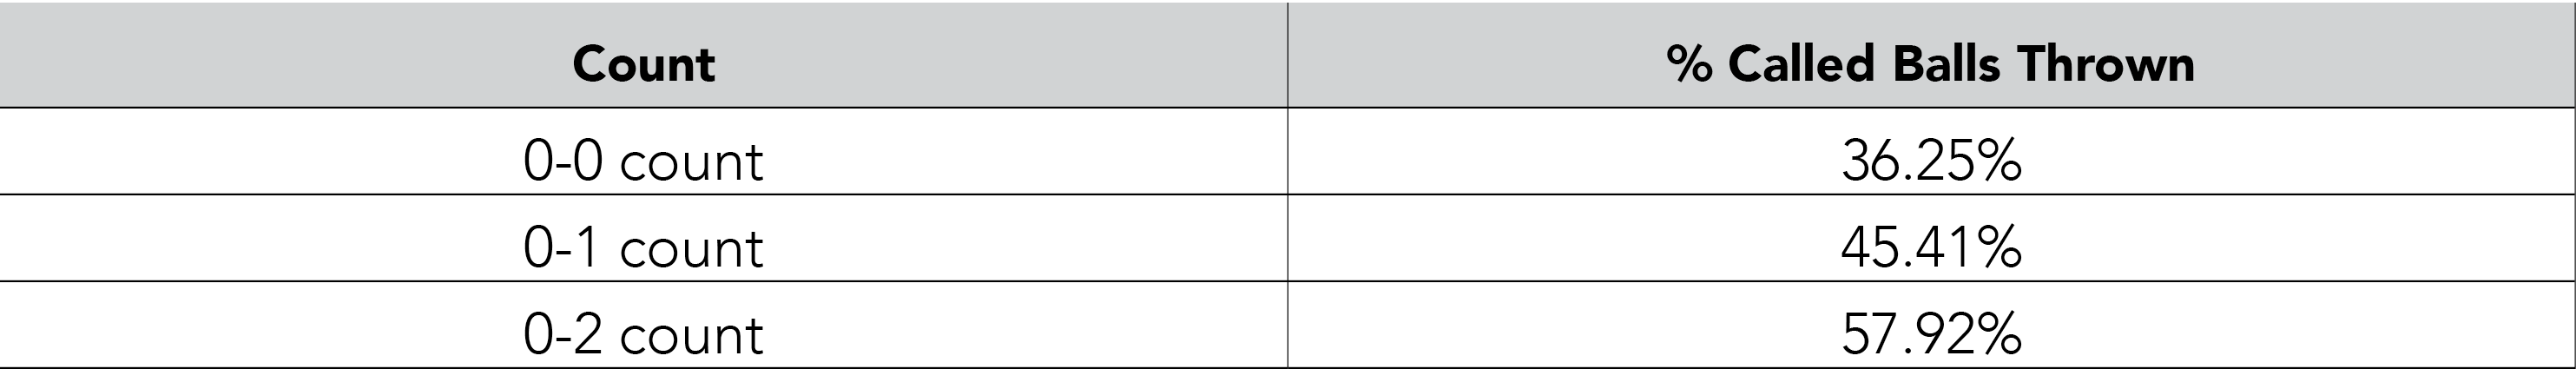
We can check if this theory laid out in the above paragraph holds in Greinke’s 2015 regular season MLB pitch data. Below, there is a table containing the percentage of called balls (meaning the batter did not swing and the umpire called the pitch a ball) Greinke threw on 0-0, 0-1, and 0-2 counts. As we can see, as the count moved in Greinke’s favor, his probability of throwing a ball out of the strike zone increased, as expected.
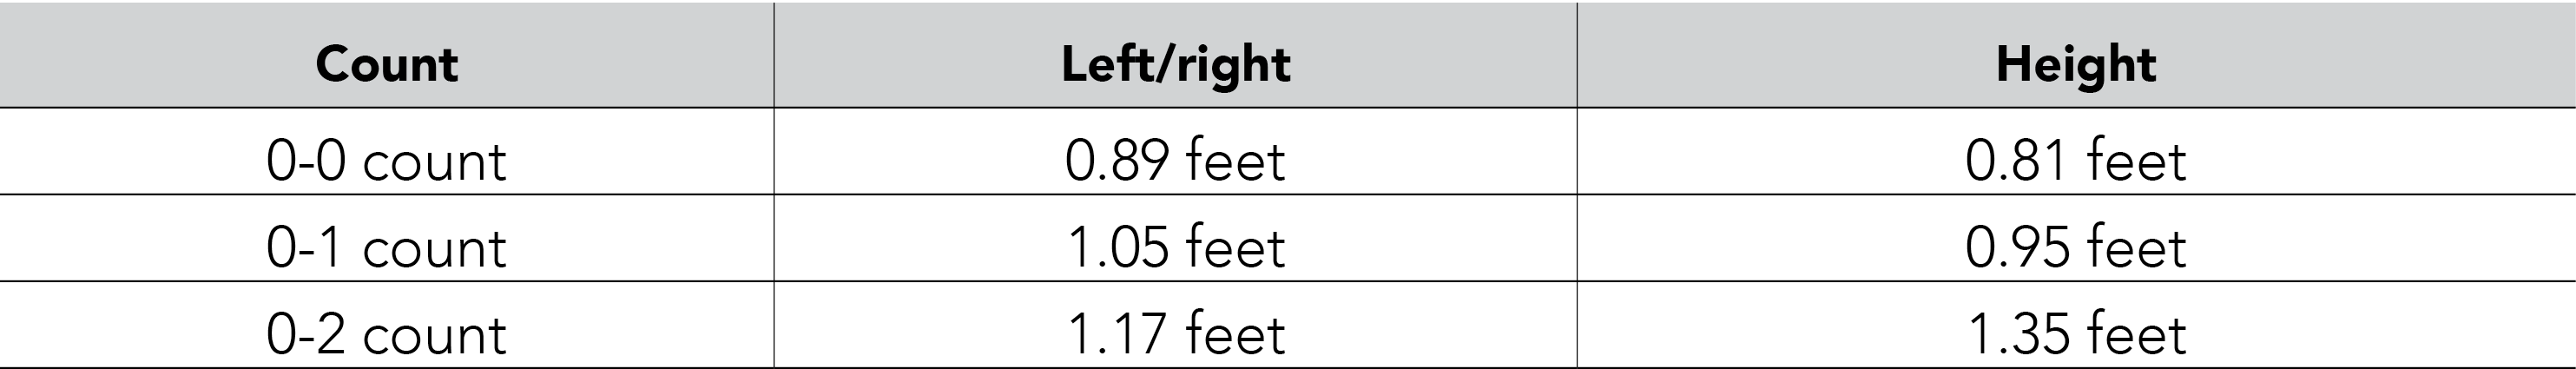
Although the table above is a good start, we do not get a full look at how often Greinke threw out of the zone vs. in the zone on different counts. Batters swing at pitches, and then we are unable to determine whether the umpire would have called that pitch a ball or a strike. To get a better look at how Greinke’s strategy changed throughout the course of the count, we will now look at the standard deviation (σ) of pitch location, which will shine light on the variability of Greinke’s pitch locations. We expect that as the count progresses in Greinke’s favor (from 0-0 to 0-2) and the risk of walking the hitter decreases, the variability of Greinke’s pitch location will increase, as Greinke becomes more willing to throw pitches out of the strike zone.
All pitch locations were measured as the pitch crossed the front of home plate. Left/right σ is defined as the standard deviation of the left/right distance of pitches from the middle of plate, where distances to the right of the center of the plate are positive and distances to left of the center of the plate are negative. As we can see in the table below, the standard deviation, or variability, of Greinke’s pitch location increases as the count progresses in his favor (from 0-0 to 0-2).
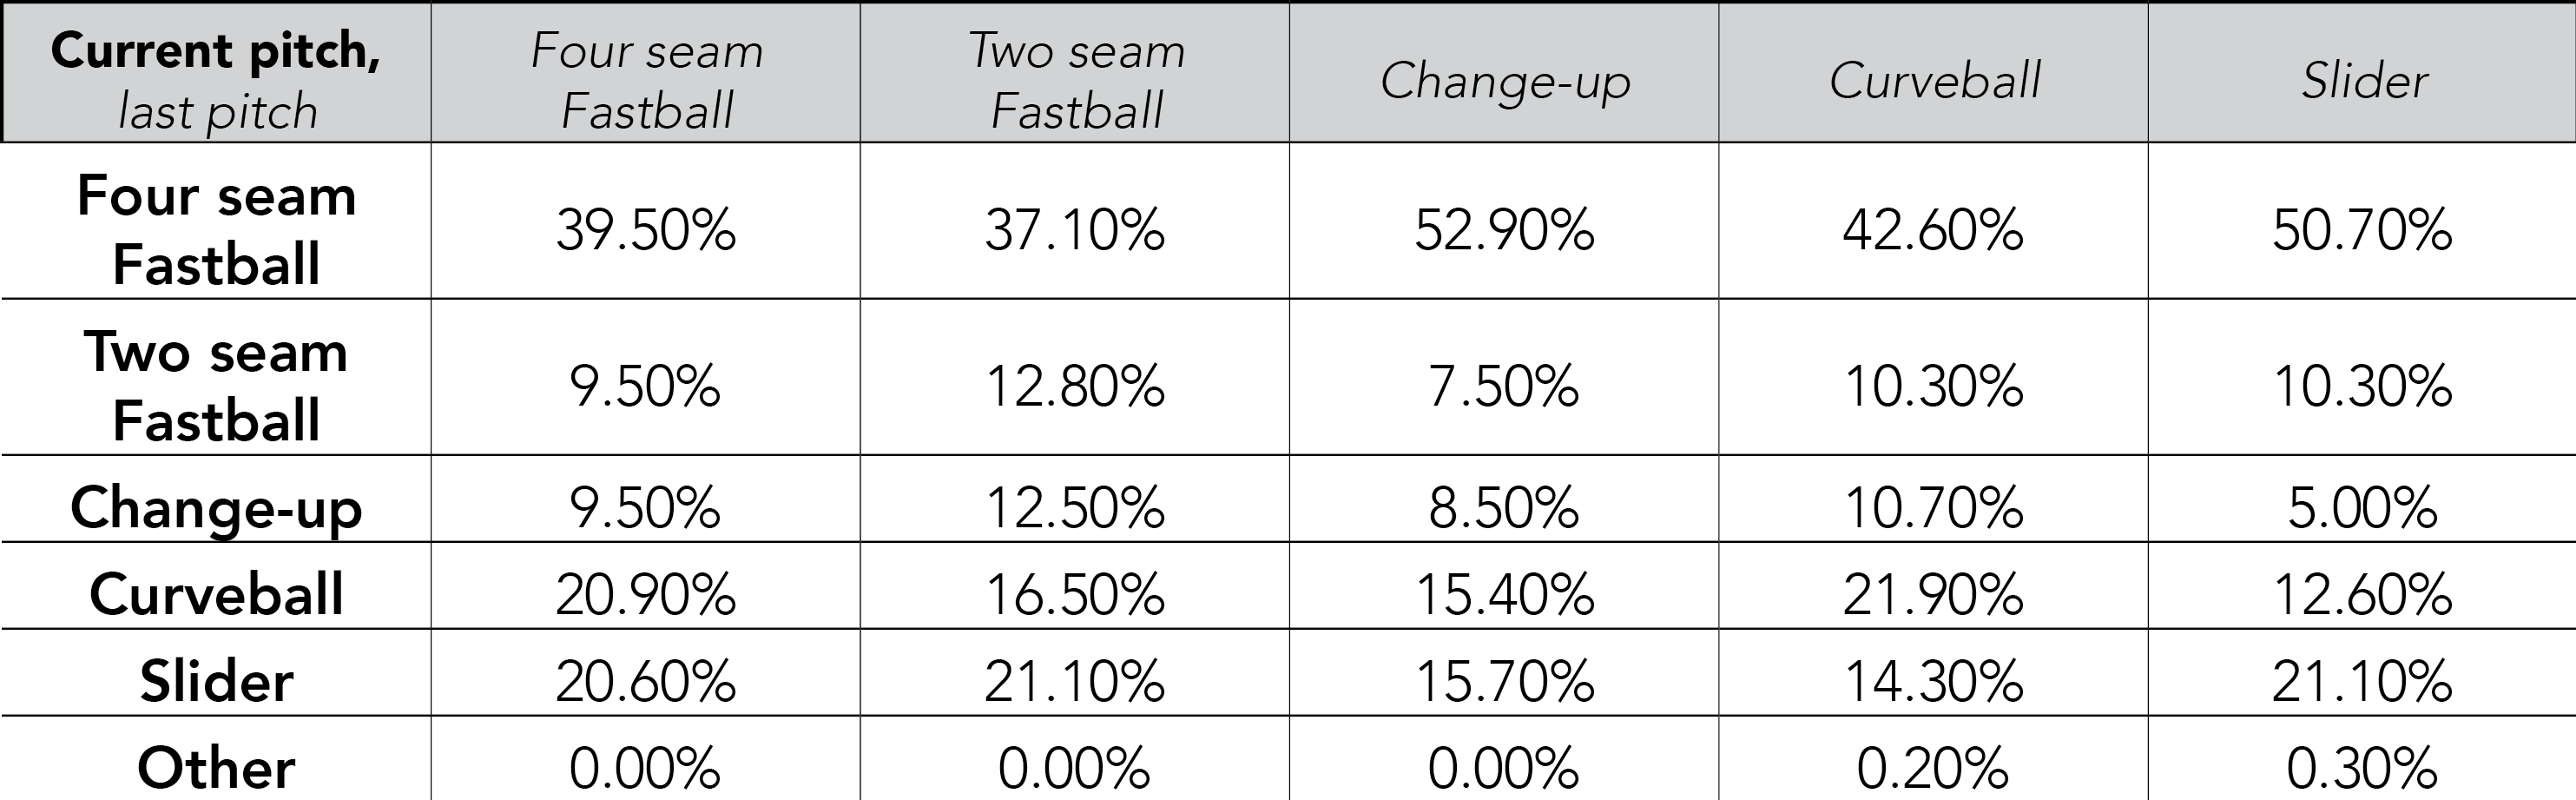
Another interesting aspect of pitching to consider is how the previous pitch impacts the current pitch. According to basic game theory, a mixed strategy equilibrium must emerge. If the pitcher always throws a fastball after a change-up, then the batter will adjust his strategy and have a massive advantage against the pitcher – again, this would be like the pitcher is playing poker with his hand up. The pitcher should throw each pitch with some nontrivial probability, regardless of the previous pitch.
Looking at Greinke’s 2015 regular season data, we can see that Greinke does in fact throw each pitch with some nontrivial probability, regardless of what he threw last. For example, during the 2015 regular season, the probability Greinke threw a slider ranged from 14.4% to 21.1%, depending on the previous pitch. Thus, it is very difficult for a batter facing Greinke to gain an advantage as the at-bat progresses, as the previous pitch does not give the batter much information on future pitches.
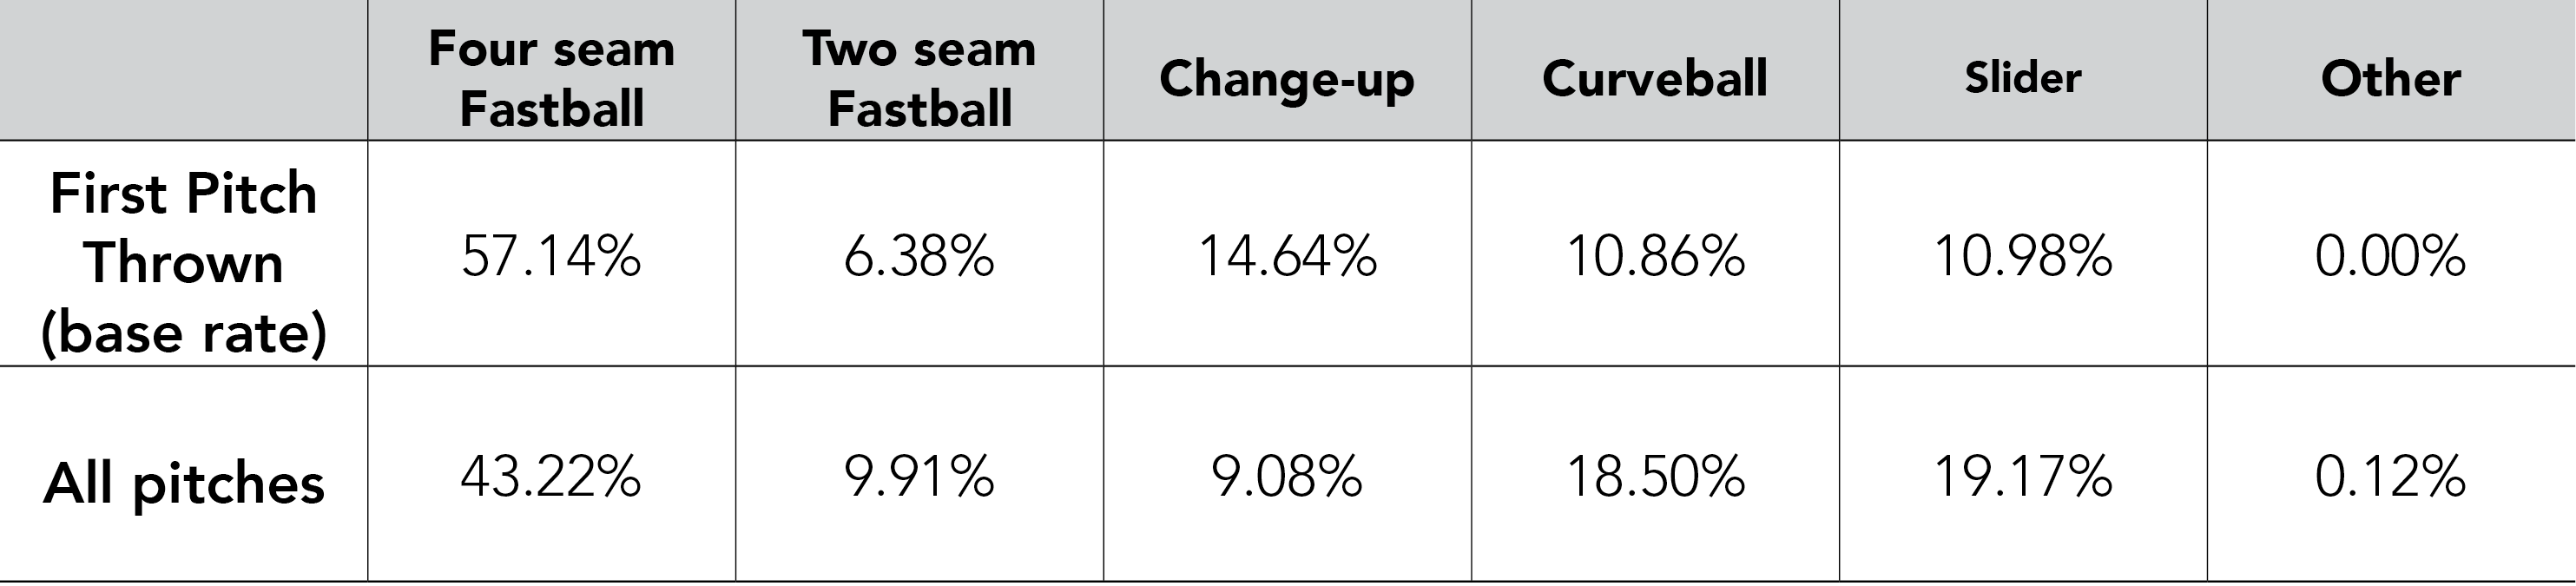
To add a little more color to Greinke’s pitch selection, his base rate percentages for each pitch thrown in his 2015 regular season are included below, where base rate is defined as Greinke’s first pitch thrown to a batter in a 0-0 count. Although Greinke threw a higher percentage of four seam fastballs on 0-0 counts, his base rate percentages are relatively similar to the percentages seen in the table above. Additionally, it makes sense for Greinke to throw a higher percentage of four seam fastballs when the count is 0-0, as four seam fastballs are easier to control and allow Greinke to throw a first pitch strike the majority of the time on 0-0 counts. The bottom row of the table shows Greinke’s pitch percentages for all pitches thrown during his 2015 regular season. Again, we see that these percentages closely mirror the pitch percentages seen before.
As you can see from the data, Greinke does a good job mixing up his pitches so he is not too predictable. If the pitcher reveals certain aspects of his gameplay, such as always throwing a fastball after a change-up (a rotten strategy…), then he opens himself up to being exploited by teams who figure out his strategy. Thus, randomness and mixed strategies are crucial to pitching. I hope that looking at Zack Greinke’s pitch count data helped illustrate this point, as well as providing a new, interesting application of game theory, statistics, and strategy.
Bonus: If you’re curious what pitch is accounted for in the “Other” column of the above tables, it includes a so-called eephus pitch (ultra-slow curveball)! You can watch an eephus pitch here.
Data source. (Photo of Zack Greinke, above, by jnashboulden, used under CC BY-SA 2.0 / resized from original)


Subscribe Now
Get each new post sent straight to your inbox